Note: This was written in Fall 2021, when Delta was predominant strain of COVID. It is not medical advice, and I have not revised or updated it in any way to account for new papers, new COVID variants, or new boosters
While the initial clinical trials on the effectiveness of the COVID vaccines were astoundingly impressive, more recent studies have suggested that the vaccines may be less effective against Delta and that their effectiveness may decline over time. This is my attempt to understand the current effectiveness of the vaccines. In particular I wanted to figure out how effective the Pfizer vaccine is at preventing hospitalization, infection, or transmission of COVID-19 6 months after the 6 second shot.
Summary
Effectiveness against Hospitalization: 6 months out against Delta, Pfizer provides 80 - 90% protection against hospitalization due to COVID-19. While these numbers are lower than those reported in early clinical trials, it’s unclear if that’s due to waning effectiveness of the vaccinates, the greater virulence of Delta, or some other factor.
Effectiveness against illness (positive COVID test): There has been a noticeable decline in vaccine effectiveness against COVID infection over time, but different studies disagree on how large a decrease there has been. With some very rough averaging, I would guess that the Pfizer vaccinate is 50% effective at preventing illness 6 months out, but I would not be surprised if the true number was anywhere between 25 and 75%
Effectiveness at preventing transmission of COVID-19: My best guess is that, 6 months out, the Pfizer vaccine is 20 - 50% effective at preventing transmission, relative to an unvaccinated person infected with COVID.
Are asymptomatic people less likely to transmit COVID?: Based on two studies, being asymptomatic means that you are about 25% less likely to transmit the virus relative to someone with symptoms.
What about the Moderna vaccine: There are fewer studies on the effectiveness of the Moderna vaccine over time, but they all seem to indicate that it holds up better than the Pfizer vaccine. There’s pretty good data indicating that, 4 months after the second dose, the Moderna vaccine is >90% effective at preventing hospitalization and slightly weaker data suggesting that it’s about 90% effective at preventing infection as well.
How does this change is you get a booster?: Data from Israel suggests that people with a Pfizer booster are about 10 times less likely to catch COVID or be hospitalized than people 6+ months post-vaccination without a booster. One key question that’s still unanswered is how long the protection from the booster shot lasts. Eyeballing the graphs in the Israel study suggests that the boosters offer max protection 3-4 weeks after the shot and start to slowly become less effective after that, while still offering substantial protection at 2 months. Data on effectiveness after 2 months will have to wait for that data to be collected.
Does it matter which booster shot you get?: If you want to play it safe and got the Pfizer vaccine, get the Pfizer booster because that’s the only combination that we have studies on showing that it substantially reduces infection and hospitalization. The not-quite-official recommendation seems to be that everyone should get either a Pfizer or Moderna booster, based on an NIH study of antibody levels that showed both of those vaccines were about equally effective and more effective than a J&J booster. If you really squint at the figures in the study, it looks like the Moderna booster might raise antibody levels a little more than the Pfizer booster, but that was using a larger dose of Moderna than what was authorized by the FDA.
Details
How effective are the vaccines at preventing serious illness (hospitalization or death)?
This is one of the simpler questions to find data about. We don’t really have to worry about testing rates for these outcomes, and hospitalization data is pretty widely collected. However, different studies also made different attempts to control for differences between the vaccinated and unvaccinated populations, and some studies lumped the Pfizer and Moderna vaccines in together.
Straightforward analysis of hospitalizations
The most straightforward analysis to do is to look at everyone who was hospitalized with COVID-19, match them up with vaccination records, and calculate the risk of hospitalization for the vaccinated and unvaccinated populations. In practice, age has such a strong effect on COVID outcomes that you at least need to control for age among the different population.
This study from New York state (https://www.cdc.gov/mmwr/volumes/70/wr/mm7034e1.htm?s_cid=mm7034e1_w#F1_down) looked at 9,000 hospitalizations due to COVID between May and July 2021. Looking at the Pfizer and Moderna vaccines together, they found a VE of about 95% for preventing hospitalizations for adults 18-49, 50-64 and >65, with no change over time as the Delta variant took over.
The data from Israel (https://www.covid-datascience.com/post/israeli-data-how-can-efficacy-vs-severe-disease-be-strong-when-60-of-hospitalized-are-vaccinated) of 500 hospitalized COVID patients that’s been kicking around the internet suggests a VE of 90%+ for preventing severe disease among adults <50 and 85% effective among adults over 50.
Another CDC study (https://www.cdc.gov/mmwr/volumes/70/wr/mm7037e1.htm?s_cid=mm7037e1_w) does a very straightforward analysis (looking at the number of hospitalized people who are vaccinated/unvaccinated), and concludes a VE of ~90% against hospitalization.
In-depth analysis of hospitalizations
A study from Kaiser Permanente (https://www.thelancet.com/journals/lancet/article/PIIS0140-6736(21)02183-8/fulltext) is a bit of a weird fish, as it doesn’t have a comparison group, but has some rather complex modeling to account for differences between the vaccinated and unvaccinated. They find no decline in vaccine effectiveness for the Pfizer vaccine at 6 months post vaccination (between 80 and 90%). They looked at 12,000 COVID hospitalizations, and controlled for a huge host of potential confounding variables, but didn’t have an explicit comparison group. Pfizer was involved in the study, and there’s some rather complex modeling, so I might take the data with a grain of salt.
Studies with a comparison group
To look at vaccine effectiveness in more detail, it’s helpful to have a group to compare against. For most of these studies, this was people admitted to a hospital for something other than COVID-19, or people admitted with COVID-like symptoms, but with a negative COVID test.
This study (https://www.cdc.gov/mmwr/volumes/70/wr/mm7038e1.htm?s_cid=mm7038e1_w) seems pretty reasonable - it’s a case control study, covered 3,600 patients, and covers adults without immunocompromising conditions. They say that >120 days after full vaccination, Moderna has a VE of 92%, Pfizer has a VE of 77% against hospitalizations.
This study (https://www.cdc.gov/mmwr/volumes/70/wr/mm7034e2.htm?s_cid=mm7034e2_w) of 18 hospitals reports a VE of 90% against hospitalization for patients without immunocompromising conditions, with no trend over time.
Yet another CDC study (https://www.cdc.gov/mmwr/volumes/70/wr/pdfs/mm7037e2-H.pdf) looking at hospitalizations for July and August 2021 reports a VE against hospitalizations of 80% for Pfizer, and 95% for Moderna. The study did not explicitly look at how VE changed over time. The study used a test-negative design, meaning they are comparing people who tested positive for COVID-19 against people who tested negative for the disease.
A large study from Qatar reported a VE of 80-90% for the Pfizer vaccine against hospitalizations, 4-6 months after vaccination, with no clear trends over time. There’s maybe some hint of decreasing protection, but the error bars also get wider as time goes on. (https://www.nejm.org/doi/full/10.1056/NEJMoa2114114).
This preprint looking at Israel data (https://www.medrxiv.org/content/10.1101/2021.08.24.21262423v1.full.pdf) gives a VE against hospitalization of 85-95%, 6+ months after vaccination. This study was a little different, in that their primary comparison was between people who received the vaccine in January versus people who received the vaccine in latter months. There’s some hint of declining effectiveness over time (91% to 86% for adults 60+, 98% to 94% for adults 40-59), but it does not appear statistically significant.
I’ve seen some additional references to data out of Israel suggesting decline protection against severe disease (e.g., https://www.nytimes.com/2021/09/17/science/cdc-pfizer-vaccine-efficacy.html), but the best numbers I’ve been able to find are in the above preprint, and they don’t seem as dire as the news article indicates. There’s this set of slides from Isreal (https://www.gov.il/BlobFolder/reports/vpb-12082021/he/files_publications_corona_vpb-12082021-01.pdf), that seem to show a drop in VE against severe COVID for those 65+ over time, but I think I trust the pre-print numbers more.
Summary of hospitalization data
My summary from these numbers that that, 6 months out against Delta, Pfizer provides 80 - 90% protection against hospitalization due to COVID-19. I’m putting more weight on the studies with a comparison group than those just looking at crude hospitalization rates. Of those studies, 4 of them reported a VE of between 80 and 90%, while one study reported a VE of 77%. Most of the studies reported no significant trend over time, making it unclear why these numbers are lower than what was found in the initial clinical trials.
How effective are the vaccines at preventing any illness (positive COVID test)?
Here we have to be a little more careful about how the groups were selected. We don’t have a lot of randomized controlled trials here, so who the populations are and how they decided who to test might play a bigger role.
The Kaiser study looked at all positive COVID tests in their database. They did a regression to attempt to account for population differences between groups, but it doesn’t look like there was any attempt to identify a control group in the study design. They see a large decrease in VE against infection, from 88% in the first month after vaccination to 53% after 4 months. VE against infection was consistently lower for ages 65+ than for other age groups.
The Qatar study used a “test-negative, case-control study design”, where they match people with positive COVID tests and people with negative COVID tests across a variety of characteristics, and then look at whether people with positive or negative PCR tests were vaccinated. They report a decrease in VE against infection from 77% 1 month after vaccination to only 22% 5+ months after vaccination. These results seem robust when they explicitly account for health care sector employment, limit to just the delta strain, or stratify by age.
Maybe the most rigorous study comes the UK, which studied vaccine efficacy using “a large, community-based survey of individuals living in randomly selected private households across the UK, where RT–PCR tests were performed after a pre-determined schedule, irrespective of symptoms, vaccination and prior infection”. This isn’t a blinded study - the participants know whether or not they’re vaccinated, but it removes any bias in who is selecting to get tested. They report a decline in VE against infection from 85% in the month after vaccination to 75% 3 months after vaccination for the Pfizer vaccine. That’s looking just at adults 18-64 years and in the Delta-dominant time period. (https://www.nature.com/articles/s41591-021-01548-7#Tab3)
The pre-print from Israel reported a decline in VE against COVID infection from 70-80% for the most recently vaccinated to 50-60% at 6+ months after vaccination.
The straightforward CDC analysis implies a drop in VE against infection from ~90% to <80% as time has gone on, but there’s not much analysis there and there are probably lots of confounding variables. (https://www.cdc.gov/mmwr/volumes/70/wr/mm7037e1.htm?s_cid=mm7037e1_w)
Another study from the UK (https://www.medrxiv.org/content/10.1101/2021.09.15.21263583v2.full.pdf) using a case-control study report a decrease in VE from 85% in the month after vaccination to 75% 4+ months after vaccination for the Pfizer vaccine.
A small study at University of California San Diego Health reported a declining VE against symptomatic infection from 94% to 65% (https://www.nejm.org/doi/10.1056/NEJMc2112981). But I’m slightly skeptical of this, since the reported VE by months after vaccination goes 94%, 96%, 96%, 94%, 65% - I’d like to see more follow up to see if it’s a blip or really is a cliff like that.
Random sampling from the UK gives a vaccine effectiveness of around 70% in adults 18-64 (https://spiral.imperial.ac.uk/bitstream/10044/1/91999/12/react1_r14_final.pdf). I haven’t pulled this data to look at trends over time though.
Summary of infection
My takeaway from all this is that there does seem to be a real decline in VE against symptomatic infection. Unfortunately, there’s a lot of variation in the absolute VE numbers between the different studies. I’m seeing numbers between 22 (in Qatar) and 75% (in the UK), which is a pretty dramatic difference. Throwing all the numbers together into a weighted linear regression, I find that at 6 months post vac, the average vaccine effectiveness is 54 or 42%, depending if I include Qatar or not. There’s a lot more someone could do to better pool these results, but I’m not going to, I’m just going to say that at this point, vaccines are probably about 50% effective at preventing infection, but honestly, it could easily be as high as 75%, or possibly as low as 25%.
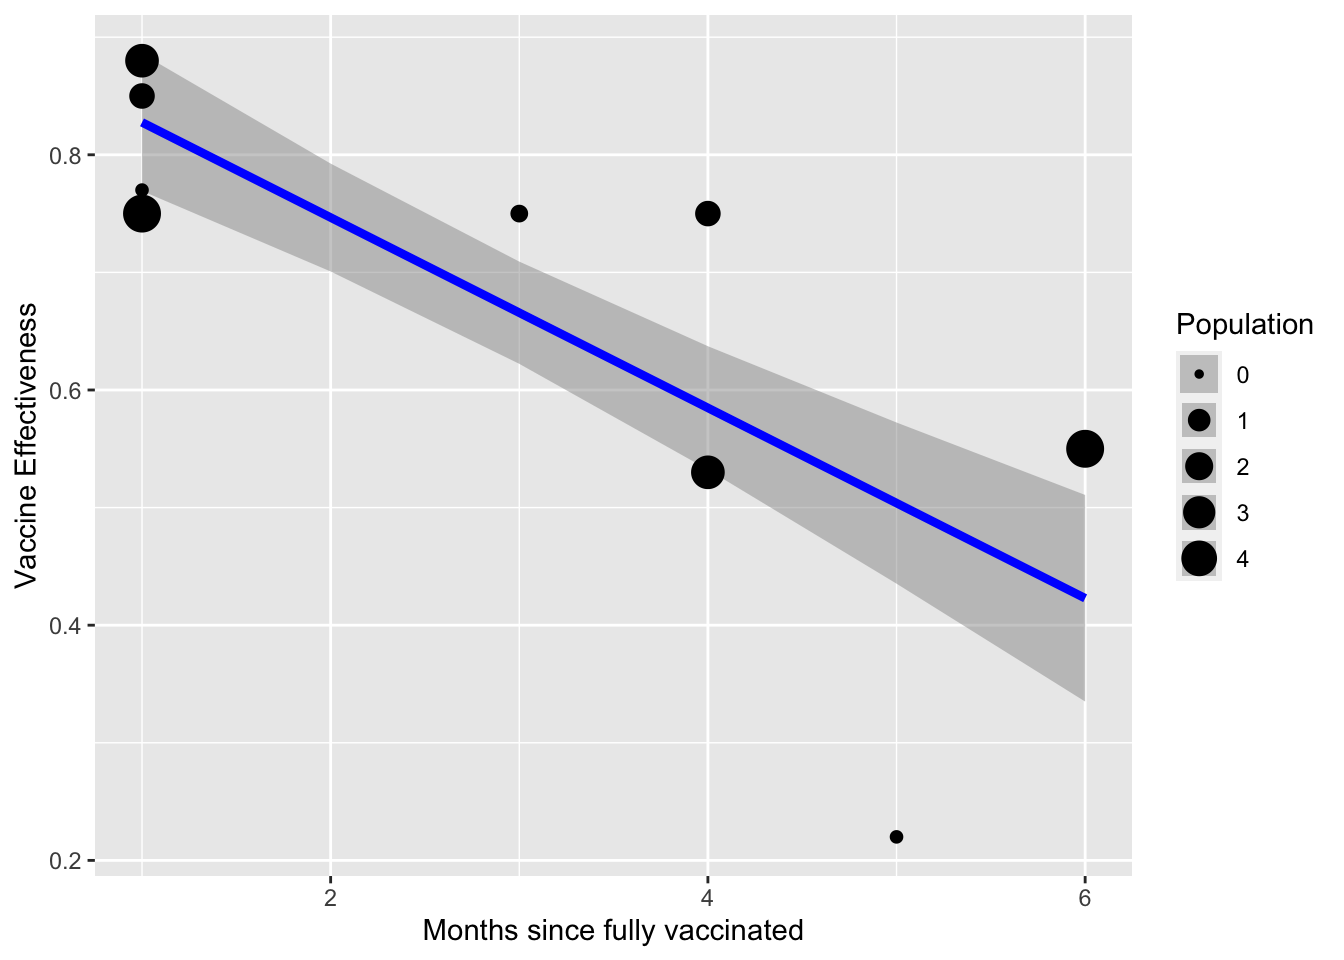
Figure 1: Vaccine effectiveness against infection over time, based on data from Kaiser, Qatar, UK (twice), and Israel
How effective are the vaccines at preventing transmission?
Background information.
As far as I can tell, there are 3 ways of evaluating how infectious someone with COVID-19 is. Going from least to most reliable, they are: Ct values, percent culture positive, and contact tracing. Unfortunately, the more reliable methods are more difficult to do, so fewer studies use them.
In a little more detail:
Cycle Threshold (Ct) values refer to the number of PCR cycles that are needed before the virus can be identified. Lower numbers mean more virus was present in the initial sample. Generally there is some maximum number of cycles that a PCR test will do, and after that number of cycles, if SARS-CoV-2 is not identified, the test comes back negative; if the virus is detected before that number, the test comes back positive. In general, a lower Ct values means a higher viral load, and in theory should mean a greater likelihood of transmission. However, Ct values can really only be compared between samples collected in the same way and run using the same PCR procedure, since things like how much virus was collected in the initial sample can affect the results. Ct values only tell you about viral genetic material, which can be present even when there isn’t any infectious virus. (https://www.tn.gov/content/dam/tn/health/documents/cedep/novel-coronavirus/Ct_Fact_Sheet.pdf)
Percent culture positive means taking a sample from an infected individual and trying to use it to grow additional copies of the virus in a lab. That needs to have pretty strict biohazard controls around it, so relatively few places can perform this test. The upside though is that this test only detects viruses that can produce other viruses, so it should be more reliable than looking at Ct values. (https://www.ncbi.nlm.nih.gov/pmc/articles/PMC7427302/)
Contact tracing is exactly what it sounds like - looking at close contacts of infected individuals and seeing how many of them came down with COVID. Effective contact tracing requires a lot of resources, and close contacts could be infected from other sources if the virus is circulating widely. However, in theory it’s the only approach that directly answers the question we’re really interested in, of how likely an infected person is to infect other people.
Studies on transmission
I’ve found two studies that used contact tracing to look at vaccine effectiveness against transmission.
One study from the Netherlands uses contract tracing to examine the spread of COVID from an index case to other members of their household. They have about 5K index cases. They report a Vaccine Effectiveness against transmission of 40-60%, lumping all the vaccines together. 55% of index cases and 60% of contacts received the Pfizer vaccine. They also say that “However, our data does not allow detailed analysis of VET waning due to small numbers and strong correlation with age and time since vaccination of the household contacts”. Overall, they find about a 10% “secondary attack rate” for a vaccinated index case to infect vaccinated contacts. (https://www.medrxiv.org/content/10.1101/2021.10.14.21264959v1.full.pdf)
Then there’s an absolute beast of a study from the UK (https://www.medrxiv.org/content/10.1101/2021.09.28.21264260v2.full.pdf) that reports a whole ton of information of transmission of COVID. It’s a retrospective cohort study on the contacts of COVID index cases. They looked at both asymptomatic and symptomatic index cases. Now, this is a pretty loose cohort, meaning that contacts were only included if they accessed testing, and it’s a little unclear to me how they determine who exactly was a contact. To me, excluding un-tested contacts suggests that the secondary attack rate will be strongly biased upwards. Only 26% of the contacts underwent testing.
The main question they had in the study was how does index case vaccination status affect onward transmission. Key results from the study for Delta were that 2 doses of Pfizer reduced the risk on onward transmission by 50% 2 weeks after the second dose, but this declines to only 25% effectiveness 14 weeks post second dose:
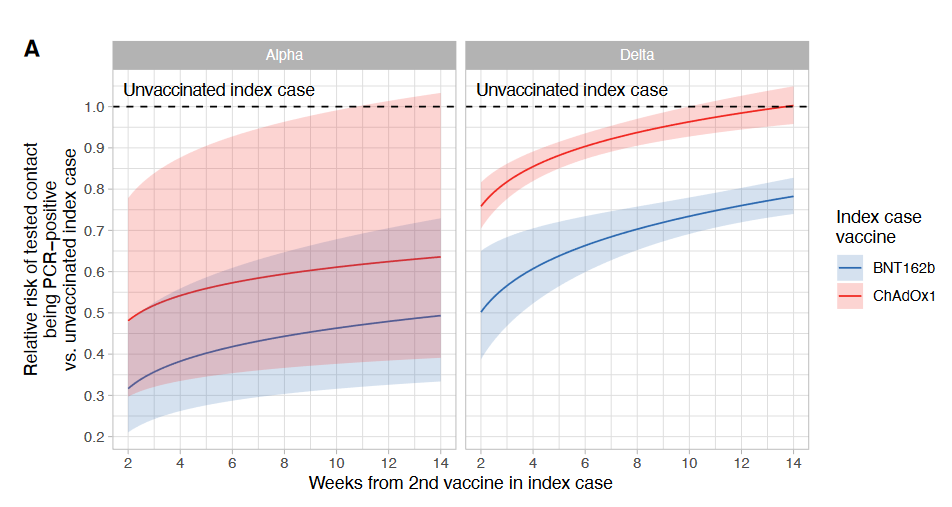
Figure 2: Vaccine effectiveness against transmission over time, from the UK study (BNT162b = Pfzier vaccine)
A second key number is that contacts of asymptomatic index cases were less likely to test positive, but with less of an effect than I would expect (adjusted risk ratio = 0.73, so ~25% less likely to transmit).
Beyond those two studies, the evidence becomes a lot more confusing.
In general, a number of studies have shown that Ct values (sometimes reported as viral load) are similar between vaccinated and unvaccinated individuals. This includes the giant UK study, a study of 200 patients from Singapore (https://www.medrxiv.org/content/10.1101/2021.07.28.21261295v1.full.pdf), and a study of 700 people from Wisconsin (https://www.medrxiv.org/content/10.1101/2021.07.31.21261387v5.full.pdf), and the study of the Provincetown outbreak (https://www.cdc.gov/mmwr/volumes/70/wr/mm7031e2.htm?s_cid=mm7031e2_w).
As far as I know, there’s one study suggesting that vaccinated people tend to have higher Ct values (meaning lower viral load) than unvaccinated people. A study from the UK that used random testing of individuals (https://spiral.imperial.ac.uk/bitstream/10044/1/90800/2/react1_r13_final_preprint_final.pdf) found that “median Ct value was higher for vaccinated participants at 27.6 (25.5, 29.7) compared with unvaccinated at 23.1 (20.3, 25.8)”. However, there’s some ambiguity in how you define “positives” - if you restrict the data to stronger positives, the difference between vaccinated and unvaccinated goes down. I’m not quite sure how to interpret all that - after all, if you looking over a narrower band, I’d expect any differences to get compressed.
However, it’s unclear what to make of these different numbers, given that a number of studies have found that Ct values either aren’t indicative of transmissability or mean different things in vaccinated and unvaccinated people.
This study from the Netherlands (https://www.medrxiv.org/content/10.1101/2021.08.20.21262158v1.full.pdf) finds that even at a same Ct value, vaccinated cases were less likely to have infectious virus (measured by percent culture positive). Eyeballing their curves from Figure 1 suggests that vaccinated people are 33% less likely to have culturable viruses at similar Ct values:
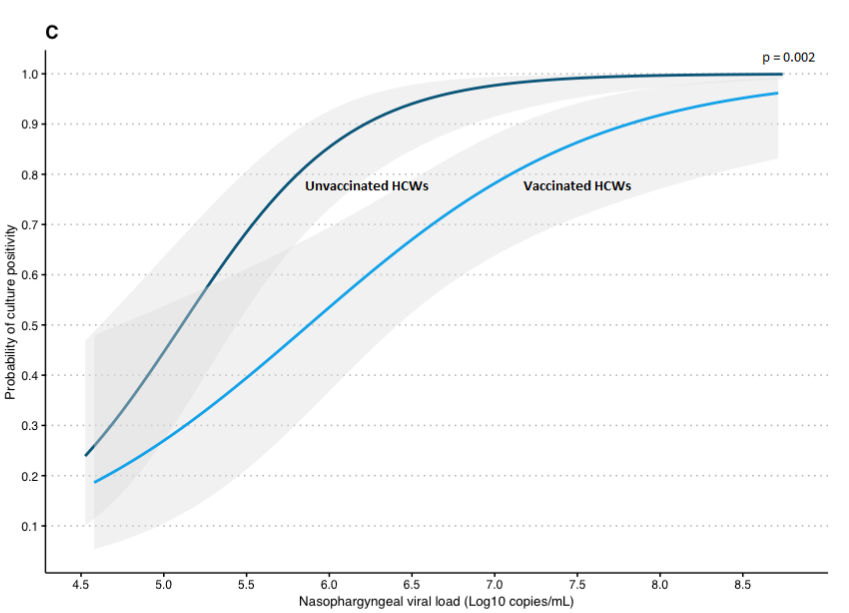
Figure 3: Percent Culture Positive versus Ct values (viral load) for vaccinated and unvaccinated individuals
The giant UK study says directly that viral loads (Ct values) are not very predictive of onward transmissibility. They hypothesize that “Vaccination may act by facilitating faster clearance of viable infectious virions, but leaving damaged ineffective virions behind that still contain PCR-detectable RNA”
My takeaway from this is that Ct values are not a very useful guide in estimating vaccine effectiveness against transmission, and we should be looking at contact tracing or percent culture positive instead. This is rather awkward since the Provincetown study which led the CDC to state that vaccinated people could transmit Delta as easily as unvaccinated people was looking entirely at Ct values.
I’ve found two studies that looked at percent culture positive between vaccinated and unvaccinated people. The study from the Netherlands reports that “The SARS-CoV-2 culture of nasopharyngeal swabs was positive in 68.6% of vaccinated HCWs versus 84.9% of unvaccinated HCWs with primary infections (p = 0.005, t-test)”. This corresponds to a 20% vaccine effectiveness against transmission. However, most of the vaccinated infections were Delta strain and most of the unvaccinated infections were pre-Delta, making it difficult to interpret this number. Just eyeballing their figure of percent culture positive v. viral load suggests that vaccination reduces the risk of transmission by about 33%.
The Wisconsin study (https://www.medrxiv.org/content/10.1101/2021.07.31.21261387v5.full.pdf) found that percent culture positive was similar between vaccinated and unvaccinated individuals. However, they cultured few enough samples that the error bars are quite large.
Summary of transmission numbers
I was able to fnid 3 and a half studies looking at vaccine effectiveness against transmission. Together they report numbers of 40-60%, 25%, 20-33%, and -28%. The negative number is from the Wisconsin study, and I don’t weight that one very heavily due to the small sample size. The other three all suggest somewhere in the 20 - 50% range, probably near the lower end of that range
Addendum 1: What difference does being asymptomatic make?
Multiple studies have found that Ct values are lower (meaning higher viral load) in symptomatic infections versus asymptomatic infections. This includes that Netherlands study, which found that “Ct-values were significantly lower in symptomatic breakthrough infections (u = 23.2) than in asymptomatic breakthrough infections (u = 26.7), corresponding to higher viral loads (p =0.022, t-test)”. If I combine these numbers with their figure showing percent culture positive v. viral load, I get that asymptomatic cases are about 75% as likely to transmit as symptomatic cases.
The giant UK study just calculates this number directly, and says that asymptomatic cases are also 75% as likely to transmit as symptomatic.
While there are other studies that show differences in viral load between asymptomatic and symptomatic cases, I haven’t found others that translate these numbers into percent culture positive, and so I think it’s best to disregard them.
Addendum 2: What about the Moderna vaccine
I didn’t focus as much on the Moderna vaccine in part because I was less interested in it (because I got the Pfizer vaccine), and in part because there just seems to be less data available on it. So far, Moderna has distributed about a third as many doses as Pfizer, so it makes sense that there would be less data on the Moderna vaccine. That being said, what I’ve found about the Moderna vaccine is generally better than the Pfizer one.
For hospitalizations, we have two studies conducted in the US that found effectiveness of 92% (https://www.cdc.gov/mmwr/volumes/70/wr/mm7038e1.htm?s_cid=mm7038e1_w) and 95% (https://www.cdc.gov/mmwr/volumes/70/wr/pdfs/mm7037e2-H.pdf) for the Moderna vaccine, compared to 77% and 80% for Pfizer.
For infection, this study from the UK (https://www.medrxiv.org/content/10.1101/2021.09.15.21263583v2.full.pdf) reported that the Moderna vaccine was 90 - 96% effective against infection 10-14 weeks after the second dose, compared to 80% for the Pfizer vaccine.
This study is from the Moderna clinical trials, so it’s pre-Delta, but it reports a VE against infection of 92% 4+ months after the second dose (https://www.nejm.org/doi/full/10.1056/NEJMoa2113017). This number is slightly higher than the comparable number I’ve found for Pfizer (85% at 4 months).
This study of health care workers (https://www.nejm.org/doi/full/10.1056/NEJMoa2106599) reported a effectiveness against infection of 96% for the Moderna vaccine versus 89% for Pfizer; however it didn’t look at vaccine effectiveness over time for the two vaccines separately, so there might be confounding effects here.
I don’t know of any studies looking at the effect of the Moderna vaccine on COVID transmission.
In summary, we have good data indicating that the Moderna vaccine is >90% effective at preventing hospitalization and slightly weaker data suggesting that it’s about 90% effective at preventing infection 4+ months after the second dose.
Addendum 3: Boosters
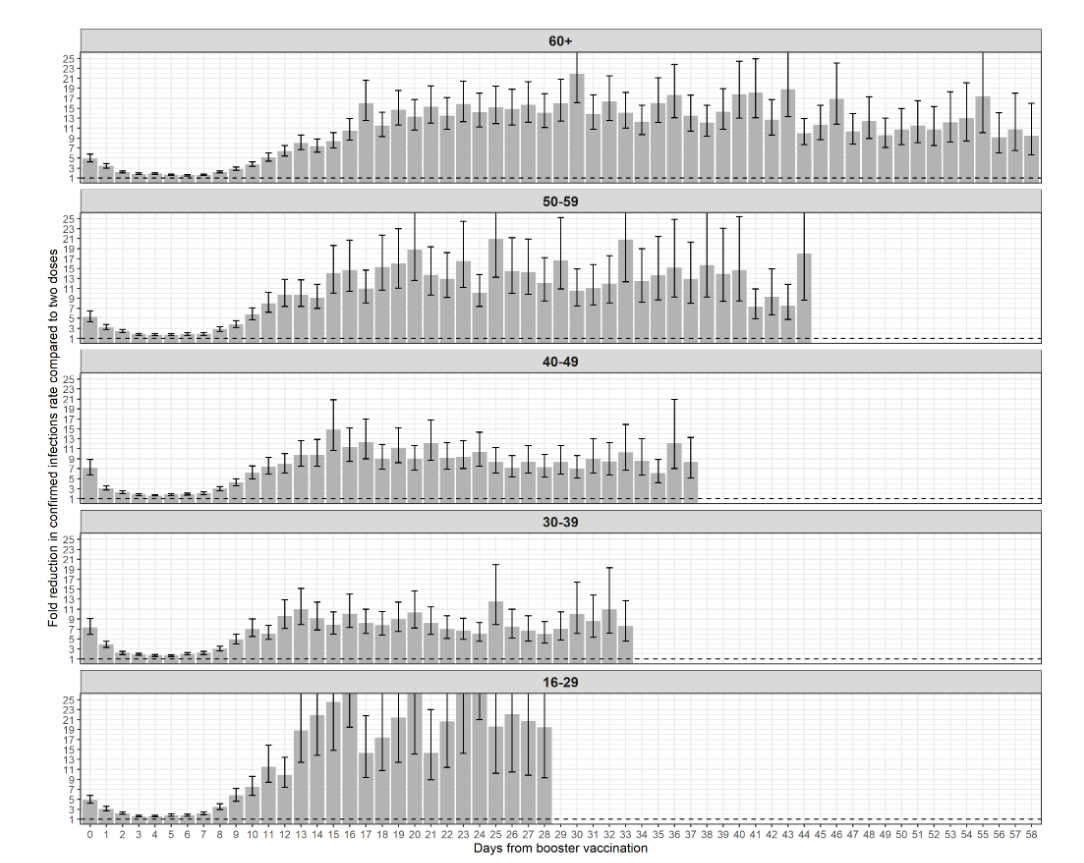
What data we have on the effectiveness of booster shots mostly comes from Israel. This study (https://www.nejm.org/doi/full/10.1056/NEJMoa2114255) reports that boosters reduce the rate of severe illness and any confirmed infection by a factor of 11 or more, up to a month after receiving the booster shot for adults 60+.
This preprint (https://www.medrxiv.org/content/10.1101/2021.10.07.21264626v1.full.pdf) has slightly more in-depth data from Israel, reporting that boosters reduce the rate of any infection by a factor of 8 or more for all age groups, and that the protection lasts at least 2 months out. However, just eyeballing their graphs it looks like the booster protection is already declining somewhat by 2 months out, which is a little worrying.

Figure 4: Added protection from a booster shot as seen in Israel
There’s also reports from Pfizer’s randomized controlled trial on booster shots, that says the booster reduces the risk of infection by 95% relative to no booster (https://www.ft.com/content/d4e58d38-37d6-40cd-9d72-6b9bfd0a3683). However, so far I’ve just been able to find press releases and news articles about the trial, so we don’t have many details about how this might break down by age group or how long the protection might last.
I don’t know of any data on the Moderna boosters other than this preprint from Moderna (https://www.medrxiv.org/content/10.1101/2021.09.29.21264089v1) that shows a booster shot raises antibody levels.
Then there’s this study on mix-and-match boosters from the NIH (https://www.medrxiv.org/content/10.1101/2021.10.10.21264827v1.full.pdf). The crucial figure is this one:
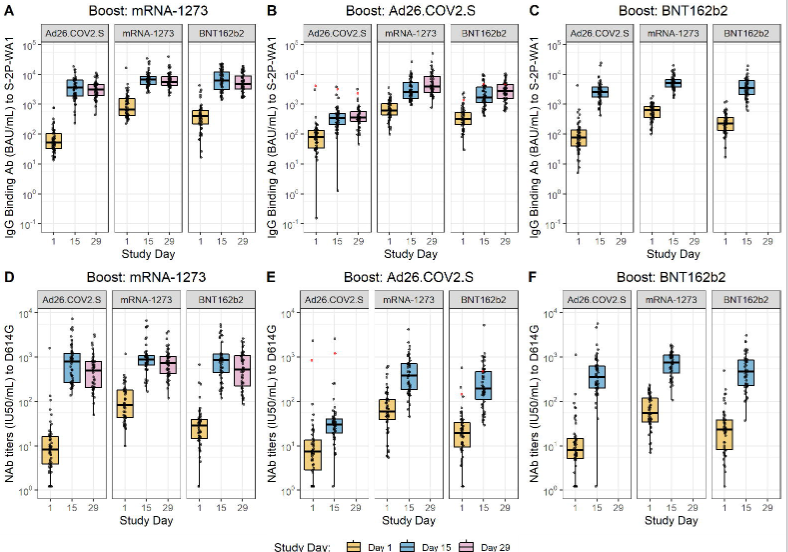
Figure 5: Antibody levels for different combinations of vaccines and boosters
The main takeaway I’ve seen from journalists and other people is that the J&J doesn’t seem like a great booster, but either the Pfizer or Moderna ones look fine. When I look at it, I would say that antibody levels look higher for the Moderna booster than for the Pfizer booster. However, this study was looking at a 100 mcg Moderna booster, and the one that was authorized was 50 mcg (https://www.fda.gov/news-events/press-announcements/coronavirus-covid-19-update-fda-takes-additional-actions-use-booster-dose-covid-19-vaccines), so it’s hard to say anything definitive about the two boosters.