What if I told you that there’s a way to improve the election forecasts from FiveThirtyEight? That it only uses publicly available information and doesn’t require any advanced math? The catch is that it only works in Iowa (but there’s a workaround).
Here’s the trick: instead of using FiveThirtyEight’s weighted average of all the polls and demographic-based predictions, use the results from Ann Selzer’s final Iowa poll.
If you haven’t heard of her, Ann Selzer is “Iowa’s queen of polling”, who has been running the Selzer & Co. polling company since 1994. She’s the “best pollster in politics” according to FiveThirtyEight and is considered the “gold standard of the gold standard” according to Nate Cohn at the New York Times.
But even with all her accolades, she is still one only pollster, and FiveThirtyEight eats individual pollsters for breakfast. Nate Silver’s key insight was that the average of all the polls, together with some historical- and demographics-based predictions, will be far more accurate than any individual poll.
It should be nearly impossible for a single pollster to consistently outperform the average, but the numbers paint a compelling picture. Since FiveThirtyEight was founded in 2008, they’ve made forecasts for 12 races in Iowa (4 for President, 5 for Senate, 3 for Governor). For all of these races, the Des Moines Register published an Ann Selzer poll of each race in the week before election day. For each race, I compared the Republican 2-party vote share predicted by FiveThirtyEight and the Selzer poll to the actual outcome.1
By every metric I can think of, Selzer has done a better job of predicting Iowa elections than FiveThirtyEight:
| FiveThirtyEight | Selzer | |
|---|---|---|
| RMSE | 2.55% | 1.85% |
| Mean Bias | -2.0% | -0.7% |
| Races called correctly | 11 | 11 |
| Closer forecast | 4 | 8 |
But wait, it gets even better. Because we can use the final Selzer & Co. poll results to improve FiveThirtyEight’s national forecast. When FiveThirtyEight runs their model, they don’t calculate 1 result. They calculate 40,000 simulations about how the election might play out. In some of these simulations, the Republican candidate does better than expected; in others, the Democrat does better. Crucially, FiveThirtyEight has put a lot of effort into studying how the polling errors in different states are correlated. That means that if a simulation has a candidate doing better than expected in Iowa, FiveThirtyEight’s simulations will usually also have them doing better than expected in Nebraska and Wisconsin, maybe a little better in Arizona, and probably about the same in California or Hawaii.
If you know where to look, you can find these simulation results. That gives us everything we need to a create an improved “Selzer+” version of the FiveThirtyEight model. We take the FiveThirtyEight simulations and weight them based on how closely they match the final Selzer & Co. poll of Iowa. Because of all the work FiveThirtyEight has done to understand the correlations between states, our weighted average will shift the national forecast in every state, not just in Iowa. In effect, we’re using the Selzer & Co. poll to anchor FiveThirtyEight’s national forecast.
Here are what FiveThirtyEight’s final predictions for the 2020 presidential election looked like, along with the Selzer+ version and the actual results:
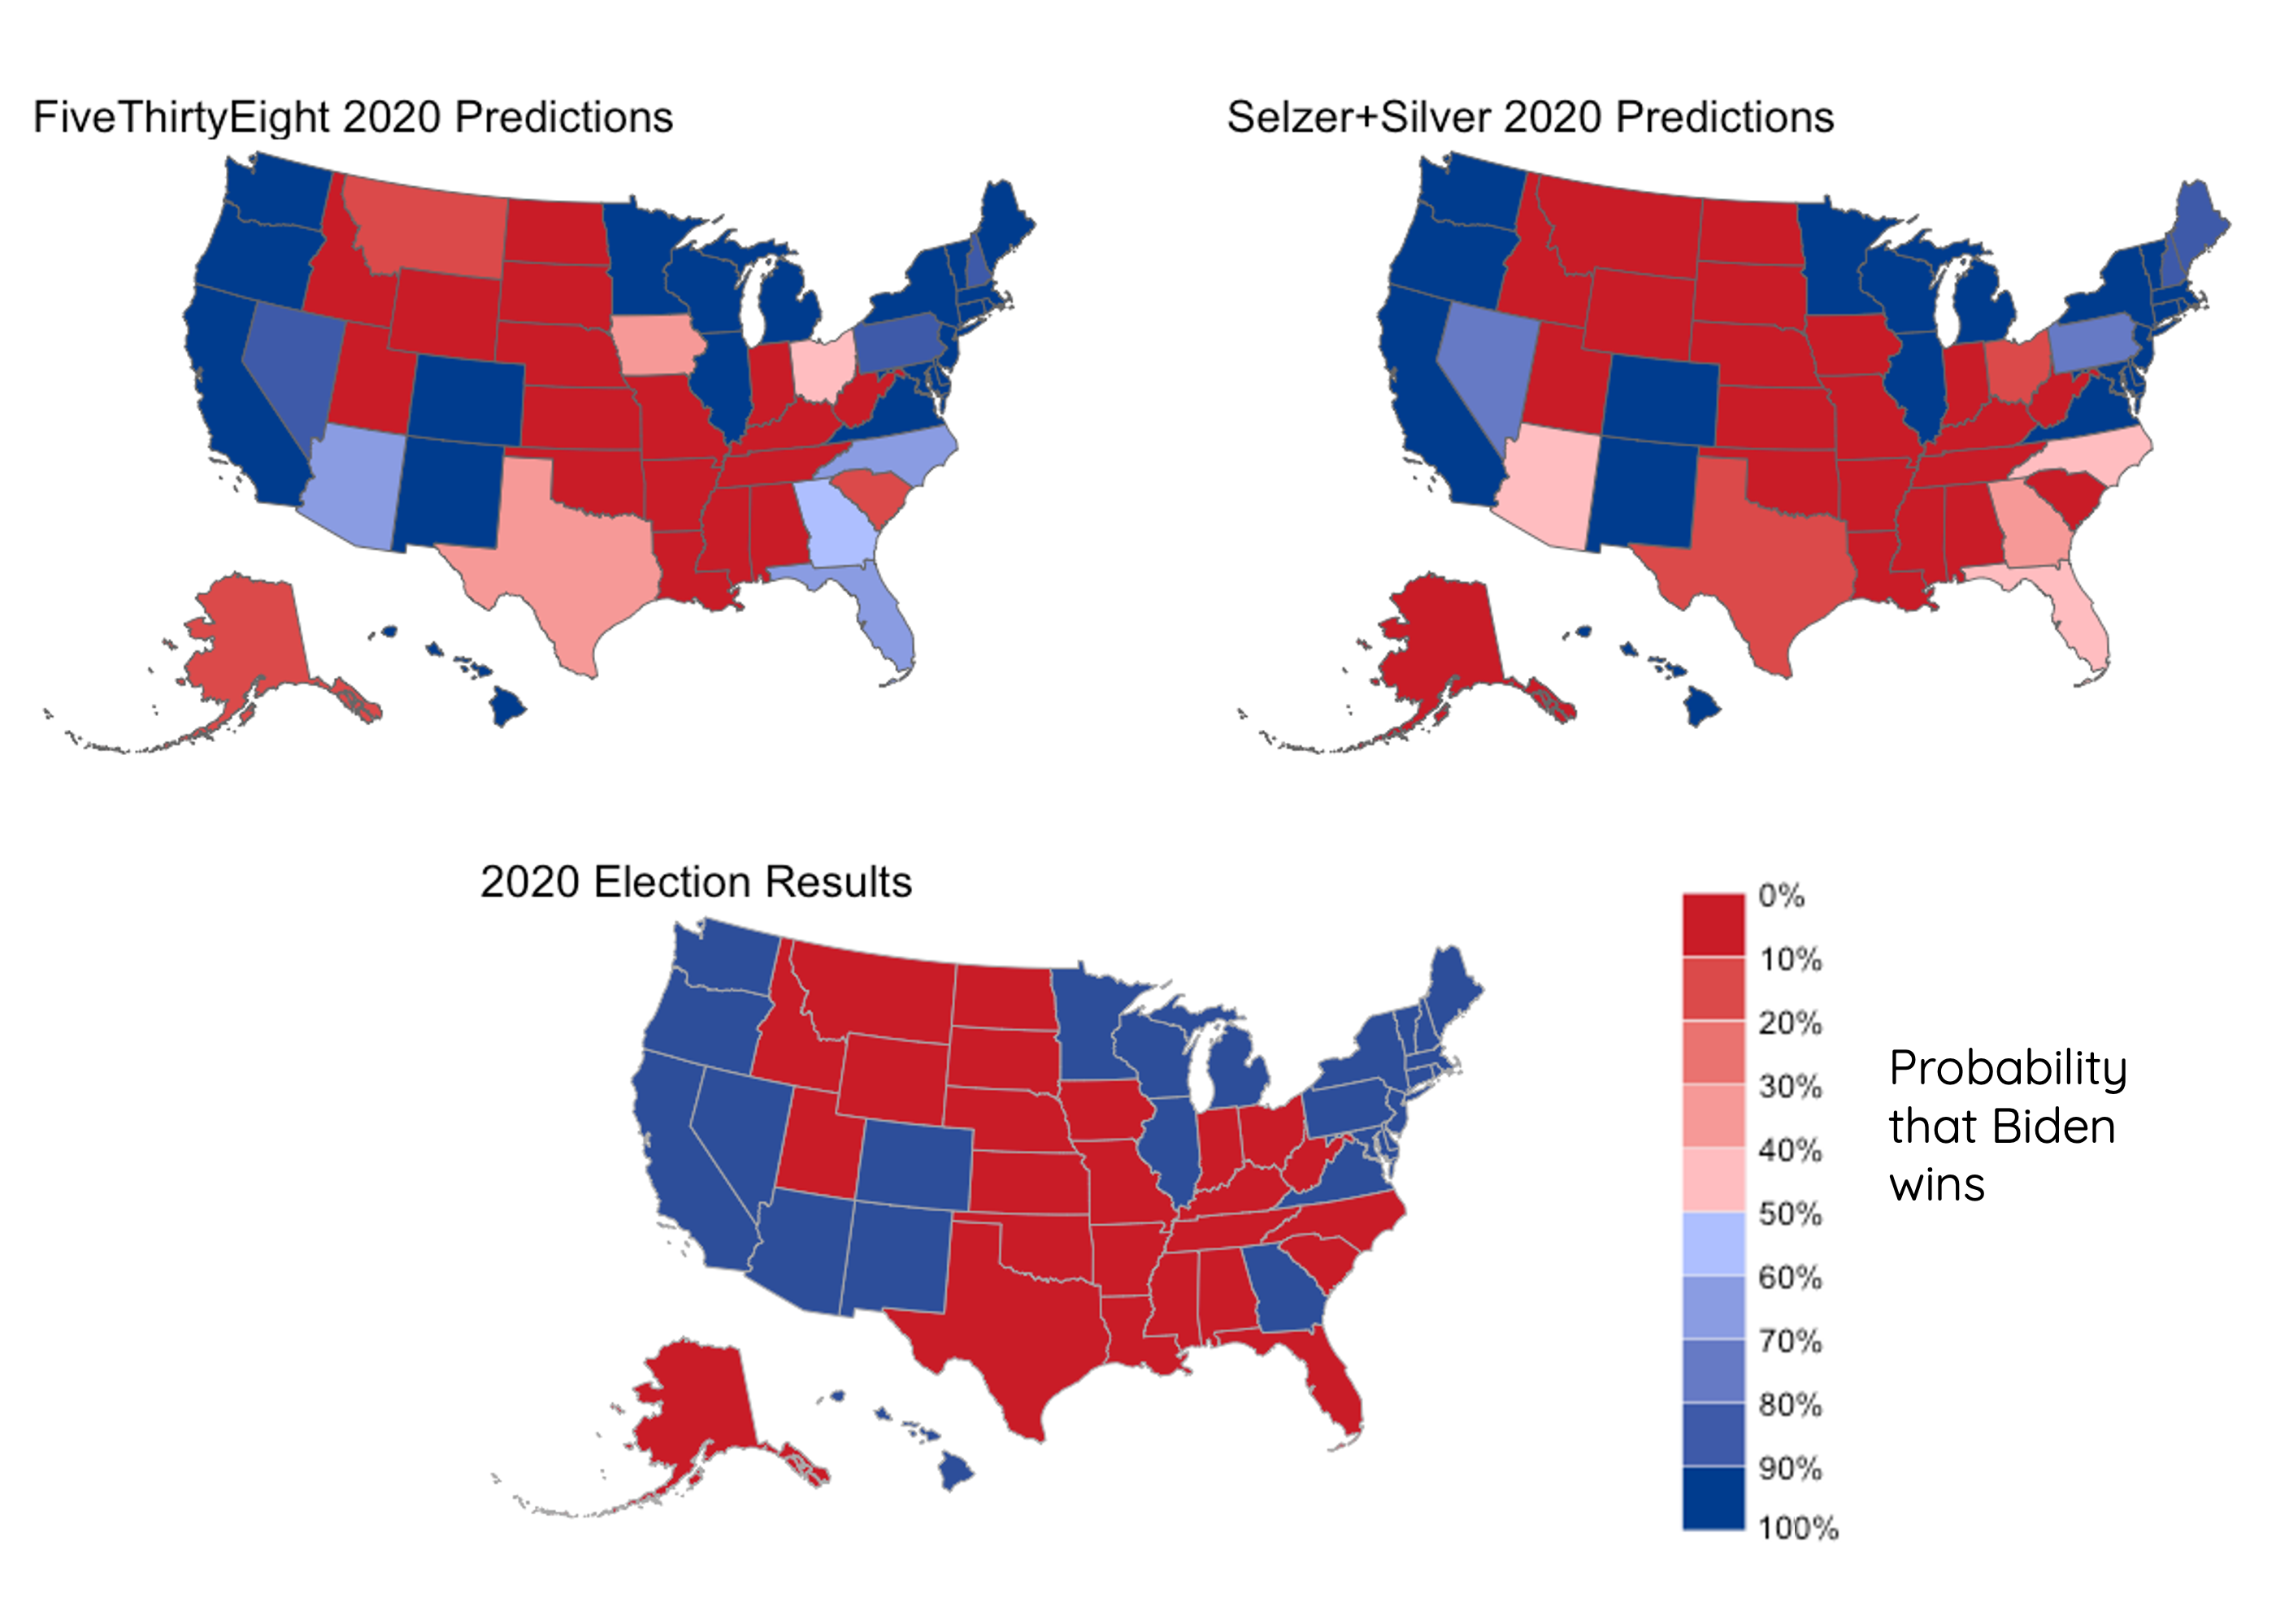
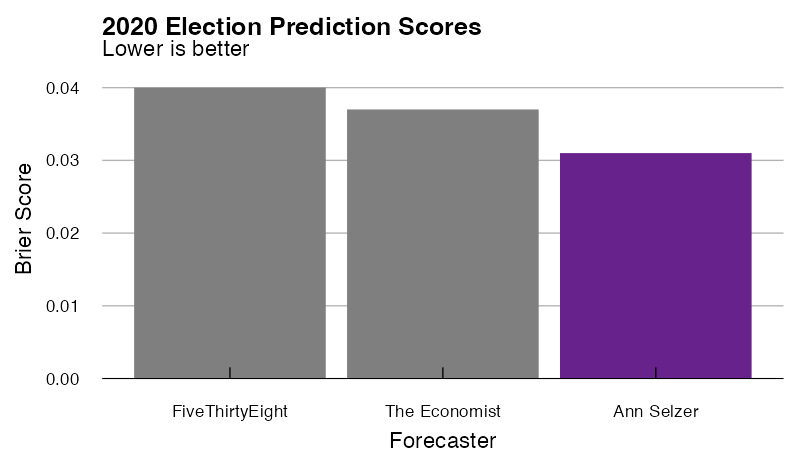
When you peg FiveThirtyEight’s model to the final Selzer poll, North Carolina, Arizona, Georgia, and Florida flip from narrow Biden victories to narrow Trump victories, and Iowa, Ohio, and Texas move from narrow Trump victors to solid Trump wins. In reality, Trump won North Carolina and Florida, but Biden won Georgia and Arizona, so it’s hard to see at a glance which model did better. We can numerically compare the results using Brier scores. Brier scores are calculated between 0 and 1, where lower scores mean the forecast was more accurate:
| Year | Election | FiveThirtyEight | Selzer+ |
|---|---|---|---|
| 2020 | President | 0.040 | 0.031* |
And lest you think that this is just due to some quirk of Brier scores, the Selzer+ model outperforms the base FiveThirtyEight model whether you look at Brier scores, RMSE in the Republican vote share (1.75% v. 2.83%), error in the expected number of electoral votes for each candidate (+27 v. -45), or the number of races called correctly (54 v. 53, because the Selzer+ model called Maine’s second congressional district correctly).
But maybe 2020 was just a particularly bad year for FiveThirtyEight. Unfortunately, that’s the only year I could find a set of FiveThirtyEight’s simulations to feed into the Selzer+Silver calculations. The best I can do is to instead look at the Economist’s election forecasts, since they put their code on GitHub and included backtests for 2008-2016. That allows us to compare the results of the Economist’s model to the “Selzer+” version for the past four presidential elections:
| Year | Election | The Economist | Selzer+ |
|---|---|---|---|
| 2020 | President | 0.037 | 0.024* |
| 2016 | President | 0.051* | 0.042* |
| 2012 | President | 0.026* | 0.024* |
| 2008 | President | 0.029* | 0.028* |
In every case, the Selzer+ model outperforms the Economist model.
So there you have it. A simple, straightforward way of improving your election forecasts. Just throw out all those polling aggregates and instead peg your entire national model to Ann Selzer’s final Iowa poll. The obvious next question is: what can we do with this information?
Introducing the Selzer+Silver Model
As I write this, the 2022 midterm elections are less than a month away. FiveThirtyEight has started publishing its daily simulations of the elections, which means we can use the Selzer+ model to generate predictions, not just analyze elections after the fact. After all, If I truly believe that Ann Selzer is better at forecasting elections than Nate Silver, then I should trust her predictions for the upcoming election more than I trust FiveThirtyEight’s. Which means it’s time for me to put money where my mouth is and make some quantifiable predictions.
So I did that. Here are the latest Selzer+Silver predictions for the 2022 midterms:
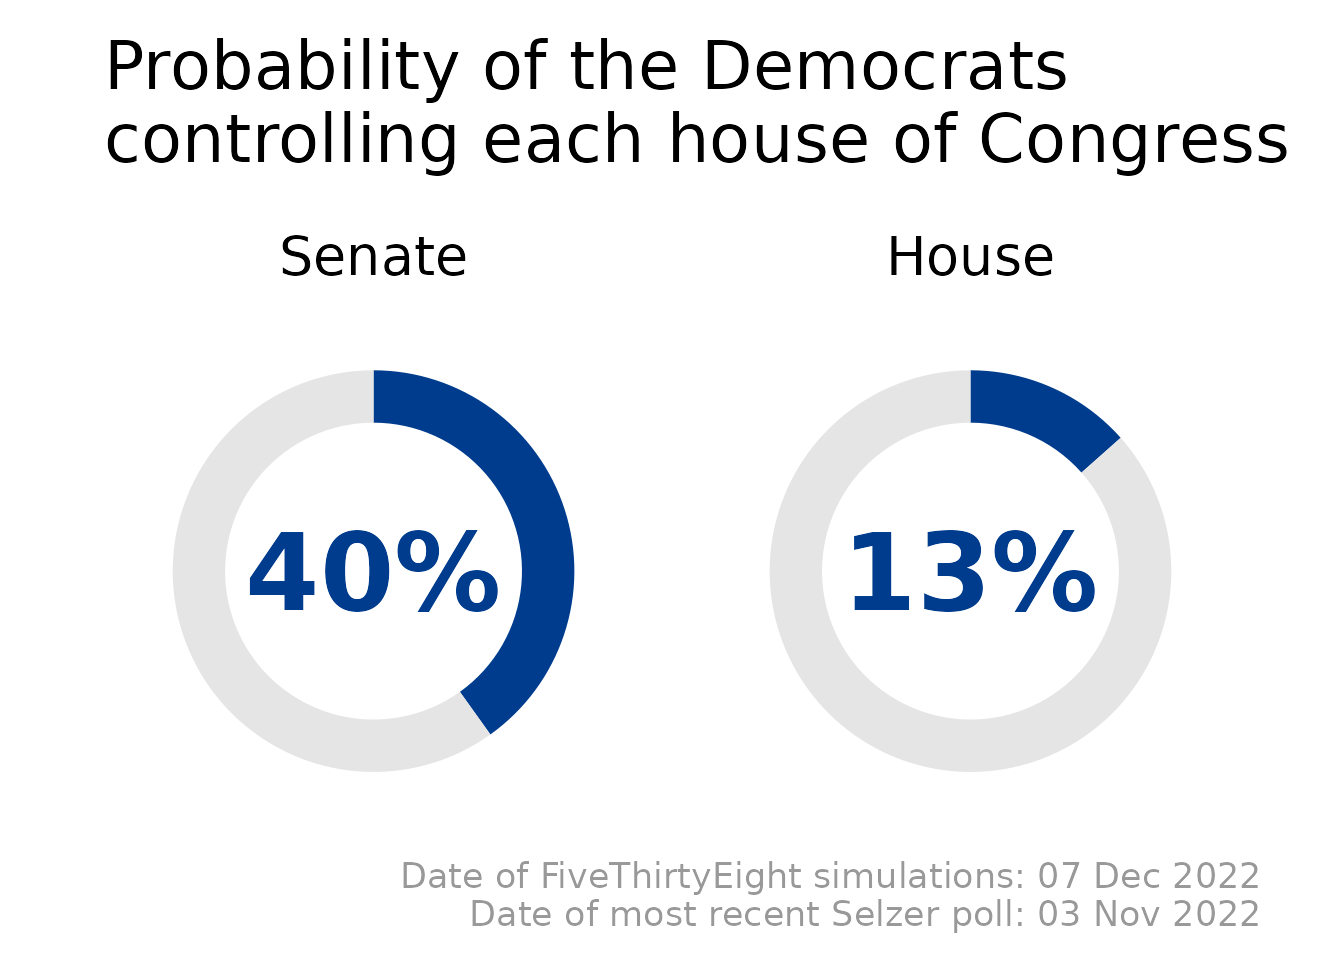
The code for this model is all on GitHub, and the predictions are updated daily.
For the forecast, instead of using Ann Selzer’s final poll (which hasn’t been released yet), we’re using her most recent poll of the Iowa Senate race to re-weight FiveThirtyEight’s national predictions. Otherwise, the methodology for the forecast is exactly the same as for our retrospective analyses:
- Take the most recent Selzer & Co./Des Moines Register poll of the Iowa senate race.
- Calculate the Republican 2-party vote share in the Iowa senate race from the poll
- Use the binomial distribution to calculate the uncertainty in the result
- Weight each of FiveThirtyEight’s daily national simulations based on how closely it matches the poll result.
- Profit.
And just in case there’s any doubt, here are my pre-registered hypotheses for how the model will perform in the upcoming election:
The Selzer+Silver model will have a lower Brier score for the 2022 Senate elections than the FiveThirtyEight model, and will more accurately predict the number of House seats won by each party
What’s the probability this is just noise?
There’s a chance that Ann Selzer isn’t magic and has just gotten lucky the past couple of election cycles. After all, there are many pollsters and one of them has to be the best. It would be silly to take this too far before checking to see if this is likely to be a fluke.
Before we start looking at some actual numbers, I want to point out two qualitative factors in favor of this being something real:
This wasn’t an exercise in data mining. I didn’t start by looking at all the polls and asking how you could pick and choose which ones to use to get the best results. I started with the question of how well you could do at political forecasting just by using Selzer & Co. polls.
Ann Selzer has been extremely accurate for a very long period of time. Politico talked about “Ann Selzer’s secret sauce” in 2015 and FiveThirtyEight called her the “best pollster in politics” in January 2016. If her earlier predictions were just due to chance, we’d expect her to suffer from reversion to the mean. Instead, her results in 2016 and 2020 were some of her most accurate results.
But we should try to be at least somewhat quantitative. Probably the simplest analysis we can do is to calculate the probability that a single pollster could consistently outperform the average of all the polls by chance alone. Specifically we want to know the probability that a pollster could outperform the average at least 8 times in 12 races. I’ll make the simplifying assumptions that Ann Selzer always polls 800 people, that FiveThirtyEight’s Iowa predictions are equivalent to an average of 6 polls of 800 people each, and the error in polls is fully characterized by their sampling error. If you run a million simulations of 12 difference races, you get the following results:
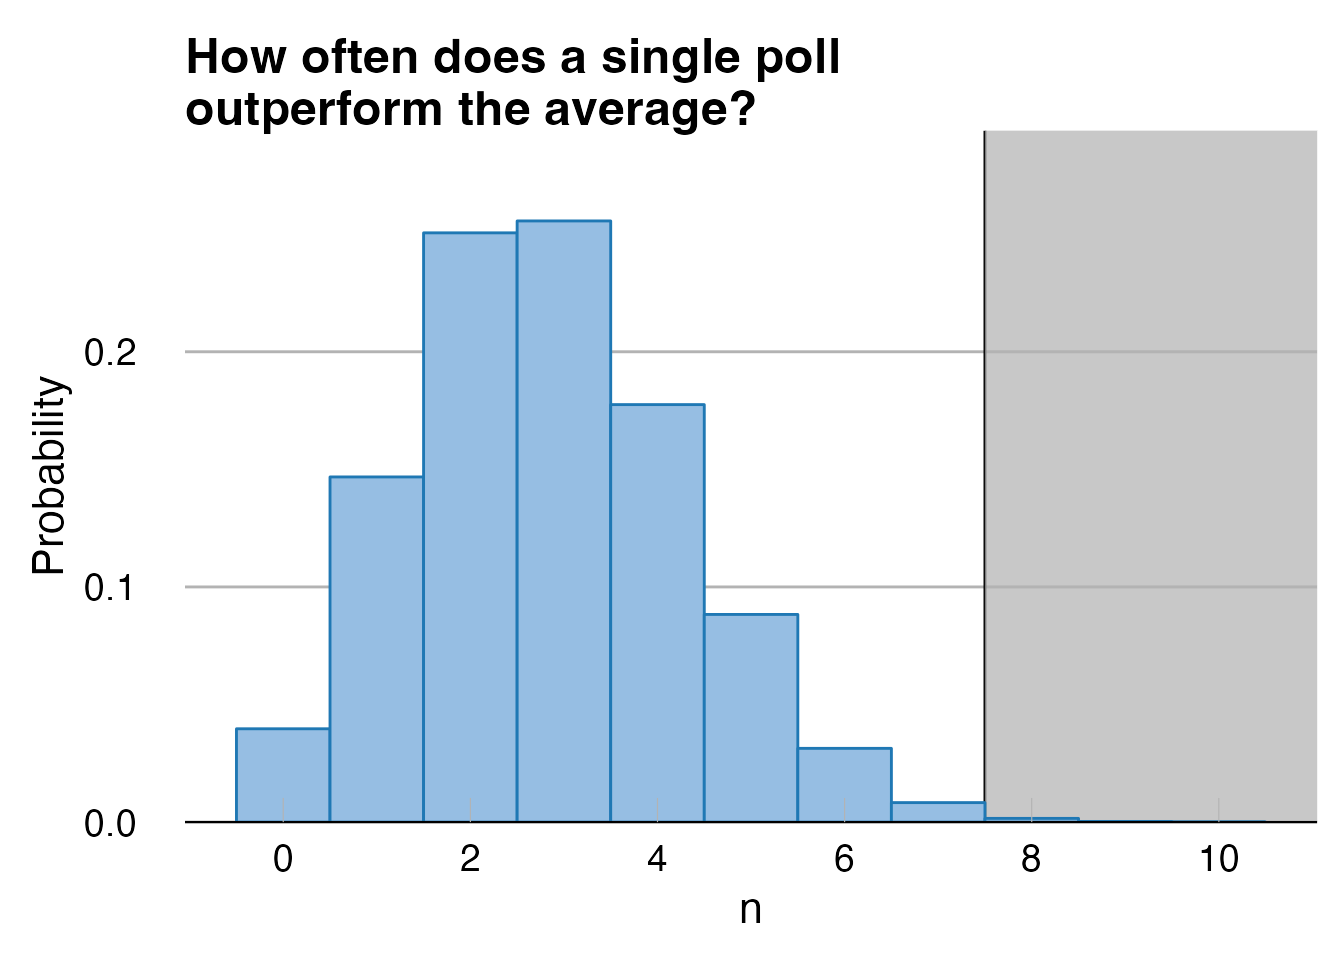
Out of 1,000,000 simulations there were only 1,800 times when a single poll outperformed the aggregate 8 or more times. That sounds like it should be a p-value of 0.0018, but we probably need to apply a correction factor for multiple comparisons, since we’d be equally interested if any pollster consistently outperformed the average. If we look in the FiveThirtyEight poll database, we find that 32 pollsters have run polls in 7 or more election cycles since FiveThirtyEight started in 2008. If we take 32 as our multiple correction factor, our adjusted p-value is suddenly 0.06. But maybe that’s unfair in the other direction, since Ann Selzer was already lauded as the gold standard for polling before the 2016 election. If we only look at her results since 2016, she’s outperformed the aggregate 4 times in 5 elections, with a p-value of 0.013 (with no correction for multiple comparisons).
All that aside, I don’t think we should apply too much weight to either the extremely low p-value without a multiple comparison correction or to the non-significant p-value with the correction. The exact details of how you set up the calculation matter a lot, and there were lots of other questions I could have asked instead. The right thing to do here would be to perform a full Bayesian analysis of the situation, but a) that sounds like way too much work, and b) I have no idea what any of the priors for the parameters should be.
For now I’m inclined to leave my conclusion as: Ann Selzer has outperformed the polling average for long enough that it’s unlikely (but still possible) that it’s a statistical fluke.
Why does this matter?
There are a number of potential takeaways from this.
First, I want you to appreciate how extremely odd this is. Since 2008, we’ve been told over and over that the one true way to forecast an election is by looking at reputable polls, averaging them, and allowing sophisticated people to build even more sophisticated models translating those poll averages into probabilistic forecasts. Under no circumstances should you ever look at a single poll, especially if it’s an outlier. Think I’m exaggerating? Here’s a recent article from the Washington post on how to interpret polls, which features comments from G. Elliott Morris (the Economist) saying to “Aggregate polls together” and Nathaniel Rakich (FiveThirtyEight) saying “don’t pay too much attention to any single poll, especially if it’s an outlier”. Here’s Nate Silver saying “When you see a poll that looks like an outlier, just throw it into the average”.
But here’s a pollster whose polls are consistently outperforming the average! Whose polls of the Iowa presidential race in both 2016 and 2020 were massive outliers, but ended up being right on the money! That goes against everything that political forecasters have been telling us for 14 years!
Second, poll aggregation is hard! Yes, it sounds simple - just take all the polls and average the results - but there are a lot of nuances you have to get right. Start with a super basic question: what is the uncertainty of each poll? The binomial distribution says a poll of 800 votes should have an uncertainty of about 1.8%, but in practice the actual error is often double that. If you want to really understand a poll’s uncertainty, you need to take into account how the raw survey results were weighted. But those numbers aren’t always reported by pollsters, so it might not even be possible for you to calculate the uncertainty.
But even if you can calculate the uncertainty of each poll, you still have to figure out how the errors between polls are correlated. If two polls are perfectly uncorrelated, then averaging them together should reduce your error by 30%. But if the polls are perfectly correlated, then averaging them together doesn’t reduce your error at all. So what determines if two poll results are correlated? Does it depend on the polls’s methodology? Where the poll was conducted? Who conducted the poll? Who the candidates are? Whether there’s currently an ongoing pandemic? The list of possible hypotheses is significantly larger than the number of election cycles we have to evaluate.
Third, (and this is way out of my area of expertise) this suggests to me that there’s so much we don’t know yet about how to conduct polls or forecast elections. Ann Selzer literally is the best pollster in politics, according to FiveThirtyEight’s analysis, and she does it without following any of the rules for good polling!
Here’s one example: Among election forecasters, there’s basically universal agreement that polls that weight by education are better than ones that don’t. That includes Nate Silver, G. Elliott Morris, Nate Cohn, Dave Wasserman, and everyone’s favorite neoliberal shill.
Selzer and Co. polls are not weighted by education. Her poll results are weighted only by “age, sex, and congressional district”. In comparison, the latest New York Times/Siena College (another A+ pollster according to FiveThirtyEight) national poll was weighted by party, age, gender, marital status, home ownership, turnout history, vote method in 2020 election, census block group density, educational attainment, region, and metropolitan area.
So how come Selzer & Co. polls are so accurate, if they don’t weight by education? Why don’t they suffer from the same Democratic bias that affected other polls in 2016 and 2020? Is her approach replicable? If I tried to conduct my own poll in Iowa following her methodology as closely as possible, could I match her performance?
And if polling could be improved, then poll-aggregation can also be improved. Over 12 elections in Iowa, FiveThirtyEight’s average error was 2.55%. That’s actually worse than you would expect from a single ideal poll of 800 voters! To me, that suggests that poll aggregators might have actually become too focused on their error bars and not enough on their point estimates. This isn’t just me speculating either - here’s Nate Silver in 2014:
The FiveThirtyEight model produces probabilistic forecasts as opposed to hard-and-fast predictions. In the same sense a weather forecaster might tell you there’s a 20 percent chance of rain tomorrow, the FiveThirtyEight model might estimate the Democrat has a 20 percent chance of winning the Senate race in Kentucky.
My view is that this is often the most important part of modeling — and often the hardest part. Predictions of the most likely outcome (“The Democrat will win the race by 3 percentage points”) are sometimes relatively immune to changes in methodology. But probabilistic forecasts can be very sensitive to them. Does that 3-point lead translate into a 60 percent chance of winning? Or a 95 percent chance? Or what?
While the error bars are undoubtedly important, and are what generally separates the rigorous forecasts from the fluff, we should remember that the point estimates are what drives the topline result. Take 2016, where all the forecasters predicted a Clinton win, and the differences among them came down to their error bars. Do you know what would have been better than putting bigger error bars on the election forecasts? Having your point estimate be a Trump victory!
Now, I don’t have any magic solutions to propose (if I did, I’d be working on becoming the next Nate Silver), but it seems like we should be thinking a little bigger than “conduct polling the way we’ve done for the past 80 years, but now weight by education”. Maybe we should be counting Google search traffic? Or convening a set of super-forecasters to make predictions about the election? Or subsidizing a prediction market about it? Or conducting a poll with an absurd sample size using random digit dialing in June and November, and have a focus group that you use to interpolate in between. Or ignoring polls entirely and hiring a team of political scientists to come up with their best “fundamentals”-based predictions? Or hiring people to stand on a street corner with a shirt that says “tell me your opinion”? Or maybe it’s to give GPT-3 the prompt “The next president of the United States is” and see what it comes up with.2
Then again, most of these ideas are clearly stupid, and the ones that aren’t obviously misguided would take a large amount of resources. It just seems like somebody should be looking into this! Maybe somebody is already and I haven’t heard about it because they’re either just getting started or they work for a political campaign and haven’t made their results public.3
I don’t know what the future of election forecasting is going to look like, but I can’t believe that FiveThirtyEight’s current approach is the best that we can do.
Here are the results for the individual elections:
↩︎Table 4: Individual Iowa election results. Bold shows the model with the best performance in each election cycle. Year Election Republican 2-Party Vote Share FiveThirtyEight Predictions Selzer Final Poll 2020 President 54.1% 50.7% (-3.4%) 53.9% (-0.2%) 2016 President 55.1% 51.4% (-3.7%) 54.1% (-1.0%) 2012 President 47.0% 48.3% (+1.3%) 47.1% (+0.1%) 2008 President 45.1% 44.0% (-1.1%) 40.6% (-4.5%) 2020 Senator 53.4% 50.7% (-2.7%) 52.27% (-1.1%) 2016 Senator 62.7% 59.2% (-3.5%) 62.9% (+0.2%) 2014 Senator 54.4% 51.0% (-3.4%) 53.7% (-0.7%) 2010 Senator 66.0% 64.5% (-1.5%) 67.0% (+1.0%) 2008 Senator 37.4% 36.2% (-1.2%) 35.2% (-2.2%) 2018 Governor 51.5% 49.0% (-2.6%) 48.9% (-2.6%) 2014 Governor 61.3% 58.6% (-2.7%) 62.8% (+1.5%) 2010 Governor 55.0% 56.0% (+1.0%) 56.8% (+1.8%) Ok, once I had this idea, I couldn’t not. When I asked this question, GPT replied “George Romney”, which is either an error or a sign of a coming zombie apocalypse↩︎
Fun fact: the candidate who spent the most money on polls in the 2020 election was, somehow, Michael Bloomberg, who spent over $25M on polling during the Democratic primary on his way to winning 1.5% of the delegates.↩︎